Using MATLAB to simulate ‘one arm distance’
In school we were made to stand in line with our arm length as a separating distance. Now I am going to use MATLAB to recreate the same situation and show how wrong our P.T. was!
I am assuming that the height ratio of a regular group with 15 people is going to be normally distributed between 150 and 185 cm. Now that we got the heights, to get the arm length of each student, we are going to use Leonardo da Vinci’s ‘Vitruvian Man’. Using the info from the painting, the ratio of the arm length to the height is about 0.375.
Defining some variables:
 number  = 15;    %number of students in a line
 minHeight  = 150;   %150 cm (60 in)
 maxHeight = 185;   %185 cm (73 in)
 ratio = 0.375;
 mean = (minHeight+maxHeight)*0.5;     %mean
‘normrand’: Gives out random numbers distributed normally based on parameters.
Parameters accepted: mean (μ), standard deviation (σ), m, n (rows & columns of matrix)
I have my mean and extrema. To calculate the standard deviation, I’ll go by the Central Limit Theorem and assume that my observations lie within 2σ of my mean.
μ+2σ = maxHeight;
σ = (maxHeight -μ)/2;
The value comes as 8.75
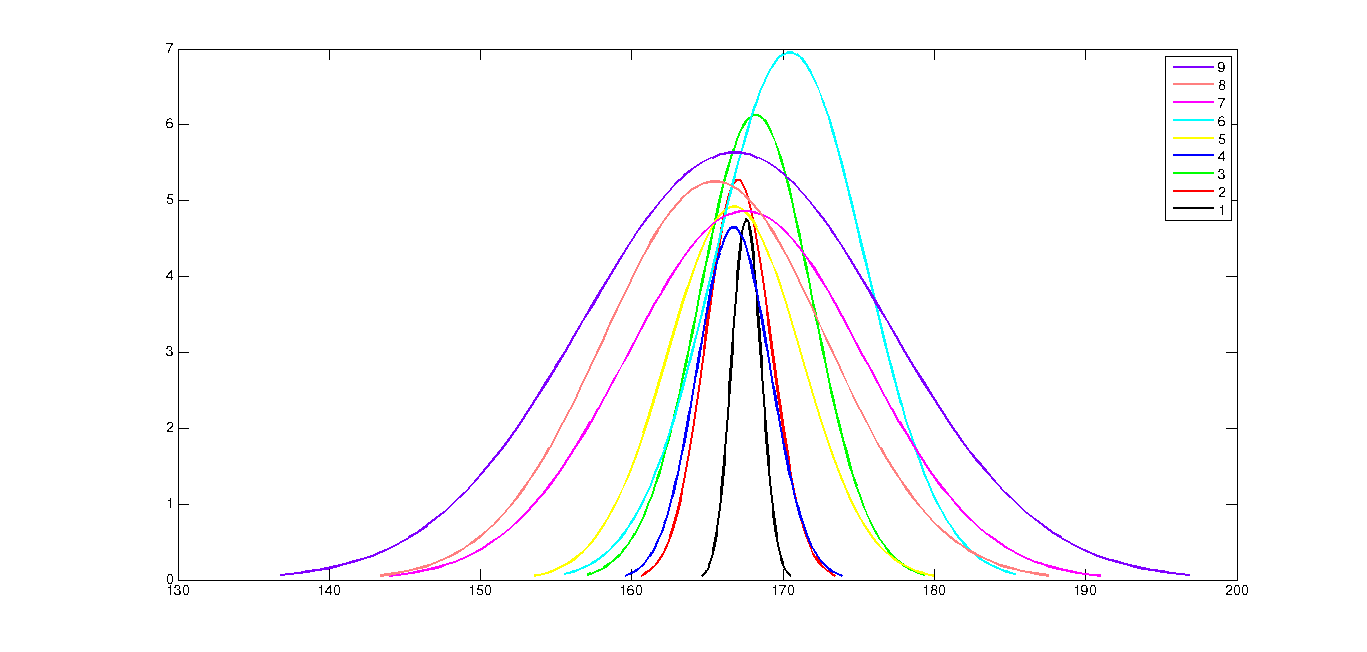
Instead of this, I can even use MATLAB to give out some normal distributions with integral σ s and approximately assume the σ value.
Fig. 1: Normal distributions with same μ, and σ varying from 1 through 9
Hence I have my μ and σ and can now proceed with the problem. I shall now define a variable heightDist which stores all my normal distributions. I am going to go through a loop to make it, but before that I need to initialise the first row of heightDist with zeroes.
 sd = 8.75;   %standard deviation
 m = 1;       %rows
 n = 15;      %columns
 heightDist = zeroes(1,n);  %Initialising heightDist matrix
 for i = 2:20  %making 19 distributions, implying 19 different lines
heightDist = [heightDist ; normrnd(mean, sd , m , n)];
 armDist = heightDist (i ,: ) . * ratio;  %armDistance multiplying height by ratio
 sortarm = sort(armDist); % sorting arm distances ascending order
 cumSumArm =cumsum(sortarm)-sortarm(1); %cumsum = cumulative sum
 y=ones(15,1).*i; %giving y offset for the 20 lines
 scatter(cumSumArm , y);   %scatter plot of cumSumArm and y
 hold on;    %to use the same graph again and again
 end
 hold off;
So, in the second line of the loop, I am increasing the size of the heightDist matrix row wise, appending the matrix with new random numbers. The initial value of i starts from 2 as the first row is the zero row.
The rest of the program is self-explanatory. In the fourth line of the loop, I subtract the sortarm(1) from the cumulative sum because I don’t want an offset from the Y-axis (the first person should always stand on the Y-axis line)
The entire program looks like:
 number  = 15;  %number of students in a line
 minHeight  = 150;  %150 cm (60 in)
 maxHeight = 185;  %185 cm (73 in)
 ratio = 0.375;
 mean = (minHeight+maxHeight)*0.5;     %mean
 sd = 8.75; %standard deviation
 m = 1; %rows
 n = 15; %columns
 heightDist = zeroes(1,n);  %Initialising heightDist matrix
 for i = 2:20   %making 19 distributions, implying 19 different lines
heightDist = [heightDist ; normrnd(mean, sd , m , n)];
 armDist = heightDist (i ,: ) . * ratio;  %armDistance multiplying height by ratio
 sortarm = sort(armDist);     % sorting arm distances ascending order
 cumSumArm =cumsum(sortarm)-sortarm(1);     %cumsum = cumulative sum
 y=ones(15,1).*i;     %giving y offset for the 20 lines
 scatter(cumSumArm , y);      %scatter plot of cumSumArm and y
 hold on;     %to use the same graph again and again
 end
 hold off;
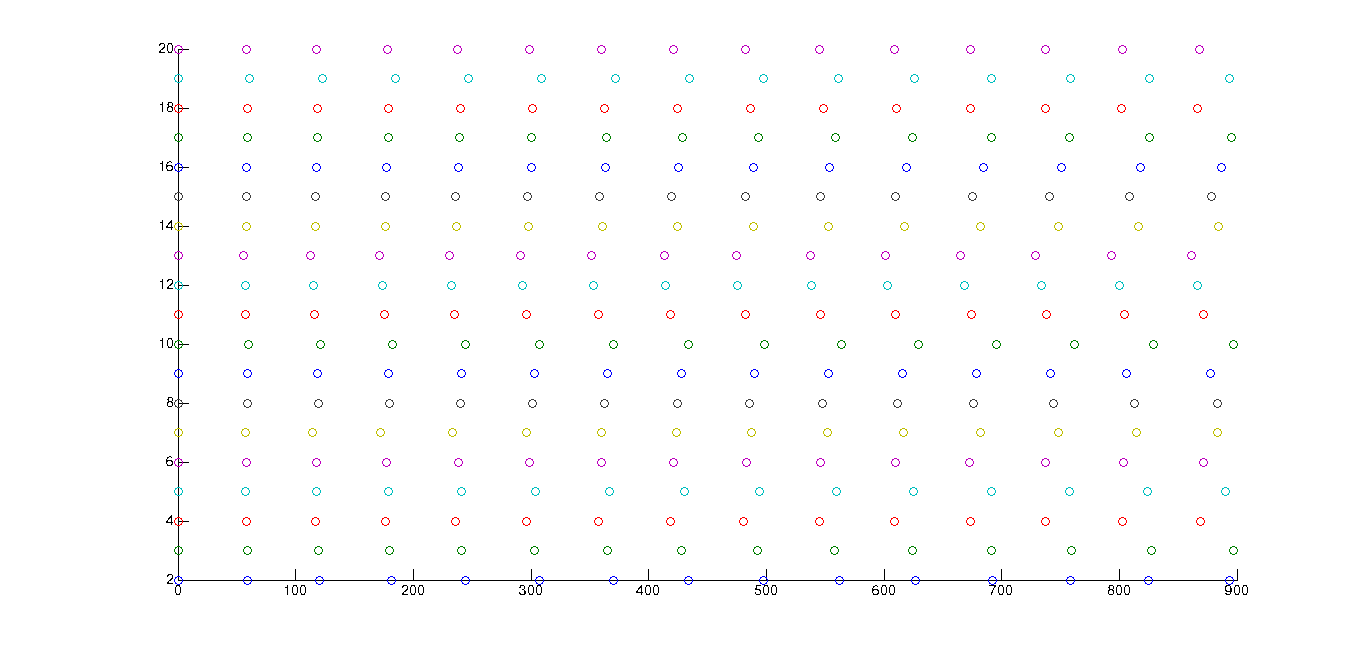
Fig 2: The final plot of students standing in ‘one-arm-distance’
(The students are lined up along the x-axis, all the students in the group are marked by the same color)
I so wish I could go back to school and show this to my instructor!
The new episode is out!

